knitr::opts_chunk$set(echo = TRUE)
library(tidyverse)TidyTuesday is a weekly data visualization challenge. The details for this week can be found here.
Introduction
This week we’re looking at edible plants. I’m interested in understanding the relationship between sun and water requirements and the caloric content of the plant. Generally I would expect that if a plant needs more energy from the sun, it’s because it is storing more sugars in it’s fruit.
I use the tidytuesdayR package to load the data the first time. Then I store it locally in a csv.
edible_plants <- tidytuesdayR::tt_load("2026-02-03")[[1]]
write_csv(edible_plants, "edible_plants.csv")
edible_plants <- read_csv("edible_plants.csv", show_col_types = FALSE) |>
mutate(sunlight = tolower(sunlight) |> str_replace_all("/ ", "/") |> factor())
edible_plants$water <- factor(edible_plants$water, levels= c("Very Low", "Low", "Medium", "High", "Very High"))Exploring columns of interest
Let’s look at the values in the sunlight, water, and energy columns.
edible_plants |>
  select(sunlight, water, energy, nutrients) |>
  glimpse()
Rows: 140
Columns: 4
$ sunlight <fct> full sun, full sun, full sun, full sun/partial shade/full sh…
$ water <fct> Very High, Medium, Medium, Very Low, High, Medium, Medium, M…
$ energy <dbl> 80, 27, 27, 88, 25, 34, 35, 31, 50, NA, NA, NA, NA, NA, NA, …
$ nutrients <chr> "Medium", "Medium", "Medium", "Medium", "High", "High", "Hig…It looks like there are a lot of NA values for energy, but we can probably use nutrients as a another output measurement. Also our inputs are going to be factors not numbers. This will impact the types of analyses we can use.
Let’s start with a basic visualization for the non-NA energy content plants.
edible_plants |>
  filter(!is.na(energy)) |>
  ggplot(aes(x = water, y = energy)) +
  facet_grid(rows = vars(sunlight)) +
  geom_boxplot() +
  theme_light()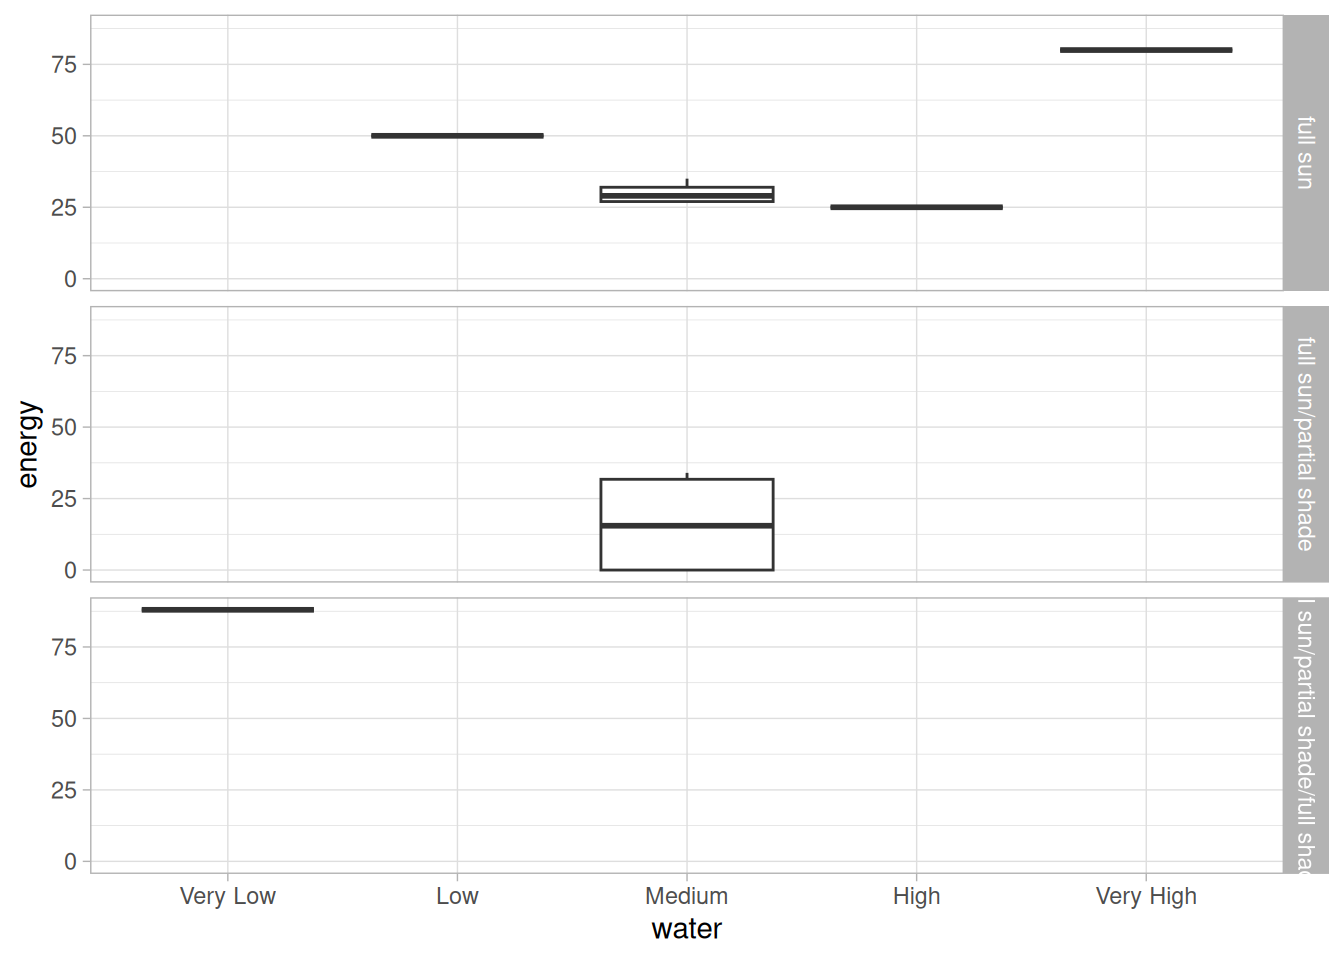
Couple notable things here:
- It looks the ability to tolerate shade is correlated with a lower caloric content.
- A surprising outlier, broad beans, or fava beans, can grow in full shade, with low water, and have the highest caloric content.
If we had more energy values, we could formalize our observations with a two-way ANOVA.
Instead, let’s look at the nutrients dependent variable. Because this is categorical as well, we’ll use an ordinal logistic regression. It’s important to note that nutrients isn’t a replacement for the energy variable. It describes the nutrient needs for the plant to grow. So a reasonable hypothesis is that if you have plenty of sun and water, you can don’t need to rely on extra nutrients in the soil.
edible_plants <- edible_plants |>
  filter(nutrients %in% c("Low", "Medium", "High"))
edible_plants$nutrients <- factor(edible_plants$nutrients, levels = c("Low", "Medium", "High"))
m <-MASS::polr(nutrients ~ sunlight + water, data = edible_plants, Hess = TRUE)
summary(m)
Call:
MASS::polr(formula = nutrients ~ sunlight + water, data = edible_plants,
Hess = TRUE)
Coefficients:
Value Std. Error t value
sunlightfull sun/partial shade -0.8533 0.3881 -2.199
sunlightfull sun/partial shade/full shade -28.1526 1.4209 -19.813
sunlightpartial shade -0.8243 0.8149 -1.012
waterLow -31.1595 0.7538 -41.336
waterMedium -28.1510 0.4607 -61.104
waterHigh -26.7838 0.5692 -47.058
waterVery High -28.1526 1.4209 -19.813
Intercepts:
Value Std. Error t value
Low|Medium -29.3183 0.4370 -67.0915
Medium|High -26.9870 0.4527 -59.6119
Residual Deviance: 238.4313
AIC: 256.4313
(2 observations deleted due to missingness)The reference values here are “Full Sun” and “Very Low [water]”. What we see here is the opposite. The ability to tolerate full shade suggests a lower nutrient requirement. Similarly any amount of water beyond “Very Low” suggests a lower nutrient requirement. Maybe the better way to think about it is that sunlight or derivative sugar molecules are used with the nutrients in biochemical reactions.
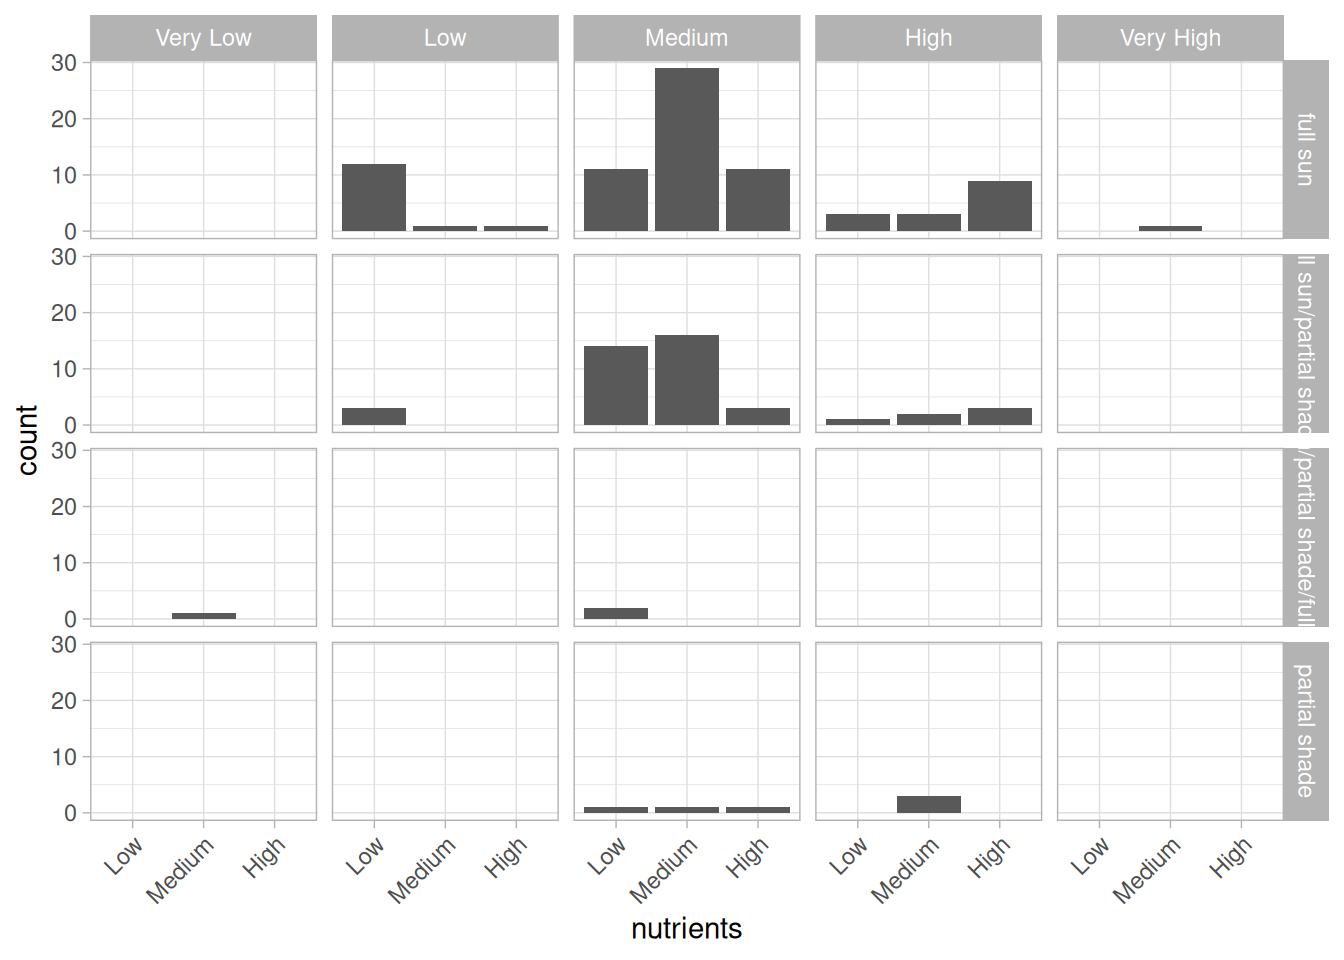
We can represent this visually here:
edible_plants |>
  filter(nutrients %in% c("Low", "Medium", "High")) |>
  filter(!is.na(water)) |>
  ggplot(aes(x = nutrients)) +
  facet_grid(rows = vars(sunlight), cols = vars(water)) +
  geom_bar() +
  theme_light() +
  theme(axis.text.x = element_text(angle = 45, hjust = 1))